
Virtual Wind Tunnel and Free Air CFD Comparison Part 1/2
Often the ultimate aim of performing a wind tunnel test on a scale model is to provide data on how the full size equivalent will behave in free air. This is especially true in motor racing (e.g., Formula 1) where teams use a combination of wind tunnels and Computational Fluid Dynamics (CFD) to guide what they hope is a winning racecar design. As a follow on to my project to build a virtual wind tunnel to test an open wheel racecar, here I start a two-part project to compare results between the virtual wind tunnel and free air using a series of CFD simulations.
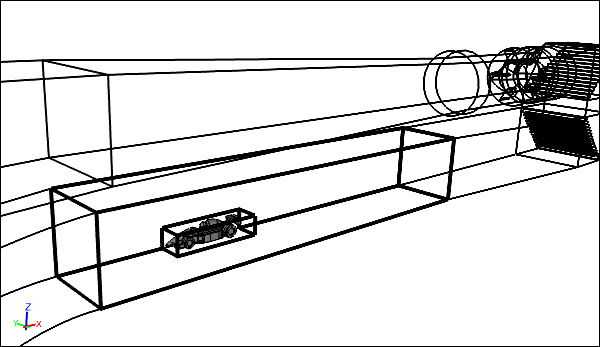 CFD Test Section for a Racecar in a Wind Tunnel
Free Air Configuration
To better simulate the racecar in free air I took the wind tunnel test section and embedded it within a larger volume with boundaries positioned approximately 5 times the maximum length of the racecar in each Cartesian direction (except upstream where it was approximately 2 lengths) away from the racecar. In this new free air configuration the outer boundaries should have a negligible effect on the final results around the racecar. Also the entire ground plane is assigned a linear velocity to simulate the moving ground under the racecar. Note that in the wind tunnel model, the moving ground is localized around the racecar model.
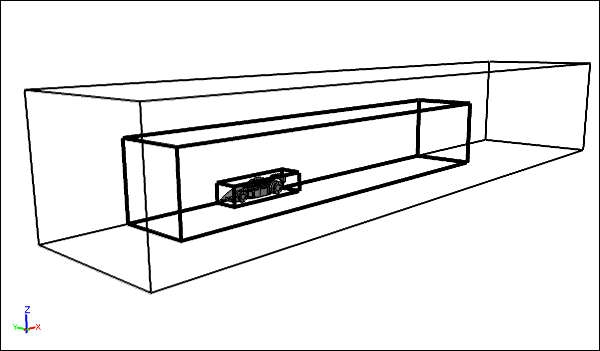 CFD Flow Domain for a Racecar in Free AirThe Original Test Section from the Wind Tunnel is Highlighted
Tests
I will run three CFD simulations in free air to compare with the wind tunnel results:
- 40% scale model in free air matching the wind tunnel conditions, Re = 3x10⁶, U = 29 m/s
- Full size model in free air with matching Reynolds number to wind tunnel, Re = 3x10⁶, U = 12 m/s
- Full size model in free air with matching velocity to wind tunnel, Re = 7.5x10⁶, U = 29 m/s
Expectations
Any differences between case 1 and the wind tunnel test will likely be attributed to the relative close proximity of the wind tunnel walls. Most wind tunnels provide a wind tunnel wall correction to modify results to be equivalent to free air, assuming the model is not above a threshold blockage area, usually about 5%. In this case the wind tunnel blockage due to the 40% model racecar is approximately 2.4%, so we should not expect a large discrepancy.
Adjusting the air speed for case 2 to match the Reynolds number of the wind tunnel test should produce similar results to case 1. There is a simple linear relationship between the racecar length and air speed, so if you scale up the racecar length by 2.5, then you need to scale down the air speed by 2.5 to maintain the same Reynolds number, assuming the density and viscosity of the air remains constant.
Increasing the air speed for case 3 to match that of the wind tunnel test should provide an indication as to whether the results are sensitive to a Reynolds number increase. Ultimately the difference between case 3 and the wind tunnel results provides a good indication as to whether the wind tunnel can accurately guide the aerodynamic design of the full size racecar.
Results
Tune in next time to see the results and conclusions in the final episode of this two-part project.
- Richard Smith's blog
- Login to post comments
Select Language
Free 30-Day Trials

Feedback
Questions? Ideas? Problems?

Recent blog posts
- CFD Simulates Distant Past
- Background on the Caedium v6.0 Release
- Long-Necked Dinosaurs Succumb To CFD
- CFD Provides Insight Into Mystery Fossils
- Wind Turbine Design According to Insects
- Runners Discover Drafting
- Wind Tunnel and CFD Reveal Best Cycling Tuck
- Active Aerodynamics on the Lamborghini Huracán Performante
- Fluidic Logic
- Stonehenge Vortex Revealed as April Fools' Day Distortion Field
 Get our Blog feed
Comments
Results and conclusions are now posted
See the results and conclusions for this CFD study at "Virtual Wind Tunnel and Free Air CFD Comparison Part 2/2".