
Essentials Manual
Familiarize yourself here with the essential elements and associated terminology in Caedium.
For an overview of the Computer-Aided Engineering (CAE) analysis process, in relation to Caedium, see "Overview: From Geometry To Results."
View our screencast for an introduction to Caedium:
The Caedium Interface consists of the following components:
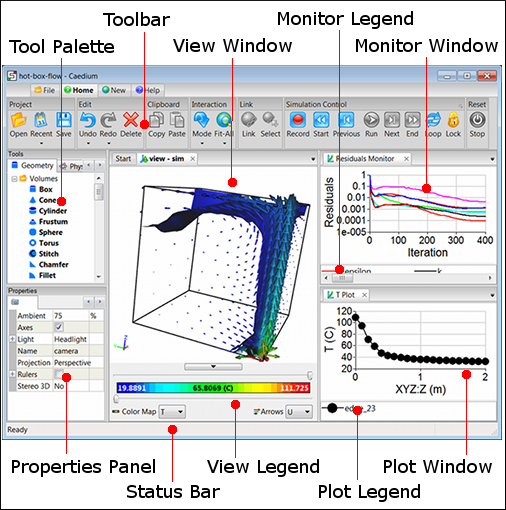
Tool Palette
The Tool Palette contains the tools you will need to:
- Create geometry
- Define physics
- View simulation results
You can also create custom tools that are specific to your simulation, for example, a new substance or a new finish.
For more see "Tools".
Properties Panel
The Properties Panel provides access to the properties (text, numbers, or options) of any item you have selected in Caedium. For example, if you select Box in the Tool Palette, the Properties Panel will display the default dimensions of a box, which you can then edit. Each object in the View Window has properties associated with it, e.g., a face has a color and style of shading.
The Properties Panel is also used to display informational messages or error messages.
View Window
The View Window allows you to view the geometry and see the results of your simulation. You can zoom, pan, or spin the view, and select an object by clicking on it with the right mouse button. You can divide the View Window into four areas, each with a different view or perspective of your simulation.
For more see "Camera View Control and Entity Selection".
View Legend
The View Legend provides access to results you have generated for your geometry. The color bar shows the full range of values displayed in the View Window and allows you to interactively set the upper and lower threshold values for the contours displayed.
Plot/Monitor Window
A Plot/Monitor Window allows you to view multiple data series plotted as curves. You can customize the axes ranges and titles using the associated properties in the Properties Panel. Also, similar to the View Window, you can interactively pan and zoom the plot/monitor.
Plot/Monitor Legend
The Plot/Monitor Legend provides access to individual data series. You can customize the symbols and lines used to represent a data series through the associated properties in the Properties Panel.
Toolbar
The tabbed toolbars (sometimes referred to as a ribbon) are a replacement for the traditional menubar and toolbar configuration seen in legacy applications. The toolbars are accessed using the File, Home, New, and Help tabs. The Home Toolbar contains the most frequently used buttons. Immediately after clicking a button on the File, New, or Help toolbars, the Home Toolbar will be reselected automatically. Clicking on the current tab will minimize the associated toolbar. Clicking the tab on a minimized toolbar will restore the associated toolbar.
Status Bar
The Status Bar, at the bottom of the window, displays the current state of the application and will also display a tooltip when you left-click a:
- Property in the Properties Panel
- Tool in a Tool Palette
Feedback
Questions? Ideas? Problems?

Comments
Please made up help and
Please made up help and manual in pdf format.
Print for a hardcopy
If you want a hard copy you can print any webpage on our website and it will be specially formatted for printing. Also you can use PDFCreator as a printer which will then produce PDF versions of a webpage.