
Using Fields and Variables
Caedium uses Pipeline Driven Technology to configure a simulation and present results. The primary Caedium simulation results are known as Fields (e.g., velocity) and Variables (e.g., time). To display your results you need to first define:
- What you want (e.g., velocity)
- Where you want it (e.g., on a wing surface)
- How you want it (e.g., contours of velocity magnitude)
To satisfy this process within Caedium you drag and drop Fields and Variables from the Results Tool Palette onto geometry entities (e.g., vertices, edges, faces and volumes) to define 'what and where.' Then through a context popup menu you select 'how' you want to represent the Field or Variable. Examples of 'how' include color map (for vertex, edge, face and volume contours), arrows, particles source/target, XY plot and monitor plot.
The available Fields and Variables are determined by the Substance (from the Physics Tool Palette) on your Simulation or Volume. When the first Field or Variable is dropped onto a geometry entity, the simulation pipeline will update, which will trigger automatic meshing and solver operations to execute as needed.
Fields
Fields define values at all nodes in a mesh on a geometry entity. Fields can be represented as color maps, particles (vectors only) and XY plots (typically on an edge). By default the X-axis is taken as the Position scalar (default X) on an XY plot and the Y-axis is the Field scalar. For vector to scalar reduction, see "Scalars and Vectors" below.
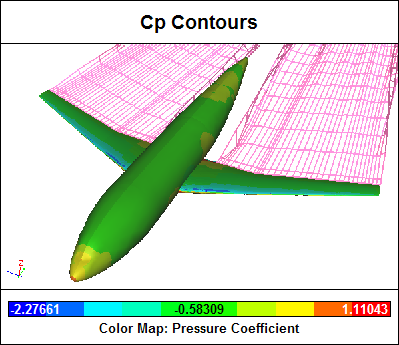 Field Color Map (Face Contours)
Variables
Variables define a single value (scalar or vector) per geometry entity (e.g., the total force acting on a face). When a Variable is dropped on a geometry entity a monitor plot is created showing the Variable scalar on the Y-axis and Time on the X-axis by default.
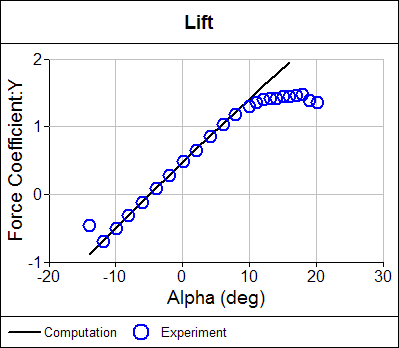
Variable Monitor Plot (Time replaced by Alpha)
Scalars and Vectors
Fields and Variables in the Results Tool Palette are subdivided into scalars and vectors. A scalar is single valued (e.g., Pressure), whereas a vector has 3 values associated with the standard Cartesian coordinate system (X, Y, Z). Caedium supports direct vector representation, such as arrows and particles for a Field and direct scalar representation, such as color maps and XY plots for Fields and monitor plots for Variables.
Each vector Field and Variable has a Scalar property that is used to reduce it to a scalar. In this way a vector can be used within a scalar representation, such as a color map of velocity magnitude. Vector to scalar reduction can be one of the 3 individual components (X, Y, Z) of the vector or its magnitude.
Related
To learn more about particles review the tutorial "Internal Flow."
For more on creating new Fields and Variables review the tutorial "Fluid Flow Around a Sphere: Theory Comparison."
To see Fields and Variables used to good effect review the example "NACA 4415 Airfoil Calculation."
Feedback
Questions? Ideas? Problems?
