
Color Map
In Caedium you can drag and drop a scalar or vector field (e.g., Velocity) from the Results Tool Palette onto geometry entities to visualize the field using a color map (also known as contours on a face or iso-surfaces in a volume). The Legend Control will then appear providing a horizontal color bar for the color-map values shown in the View Window.
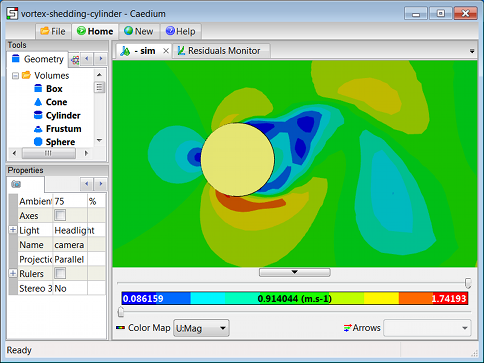 Color Map on a FaceShowing Legend Control (bottom center)
Color-Map Properties
Color-map properties are presented in the Properties Panel when you left click the Color Map title in the Legend Control.
The color-map properties are:
- Colors - number of colors to use in the color bar and in the View Window
- Range - option to use Auto, which automatically sets the range bounds according to minimum and maximum values, or Manual, which allows manual specification of the minimum and maximum values
- Reverse - check box for reversing the color-map scheme, e.g., blue = low, red = high, if reversed then red = low, blue = high
- Scale - option to set color-bar scale from Auto, Linear or Log10. Auto selects either Linear or Log10 depending on the range of the values
- Scheme - option to use a Color (red-blue) or a Gray (scales) color bar
Color Bar
By moving the mouse pointer to a specific location on the color bar a tooltip will appear showing the value that corresponds with the color under the pointer. Subsequent pointer movement along the color bar will update the value shown in the tooltip.
Thresholding
The slider bars below and above the color bar provide value clipping (or thresholding). The lower slider controls the minimum threshold and the upper slider controls the maximum threshold.
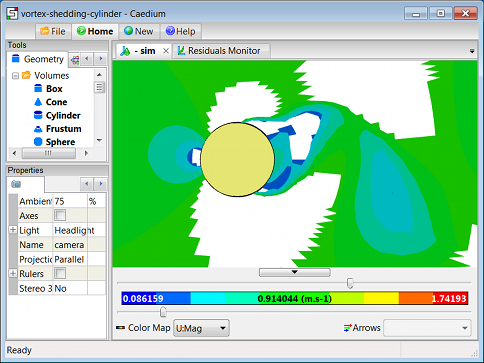 Thresholding on a Face
Note
To control the presentation of the color map (e.g., flat or smooth shading) on the geometry entities in a View Window then use the associated entities' view properties in the Properties Panel.
Feedback
Questions? Ideas? Problems?
